nengolib.stats.ScatteredCube
-
stats.cube= ScatteredCube(low=array([-1]), high=array([1]), base=Rd())
-
class
nengolib.stats.ScatteredCube(low=-1, high=1, base=Rd())[source]¶ Number-theoretic distribution over the hypercube.
Transforms quasi Monte Carlo samples from the unit hypercube to range between
lowandhigh. These bounds may optionally bearray_likewith shape matching the sample dimensionality.Parameters: - low :
floatorarray_like, optional Lower-bound(s) for each sample. Defaults to
-1.- high :
floatorarray_like, optional Upper-bound(s) for each sample. Defaults to
+1.
Other Parameters: - base :
nengo.dists.Distribution, optional The base distribution from which to draw quasi Monte Carlo samples. Defaults to
Rdand should not be changed unless you have some alternative number-theoretic sequence over[0, 1].
See also
Notes
The
RdandSoboldistributions are deterministic. Nondeterminism comes from a randomd–dimensional shift (with wrap-around).Examples
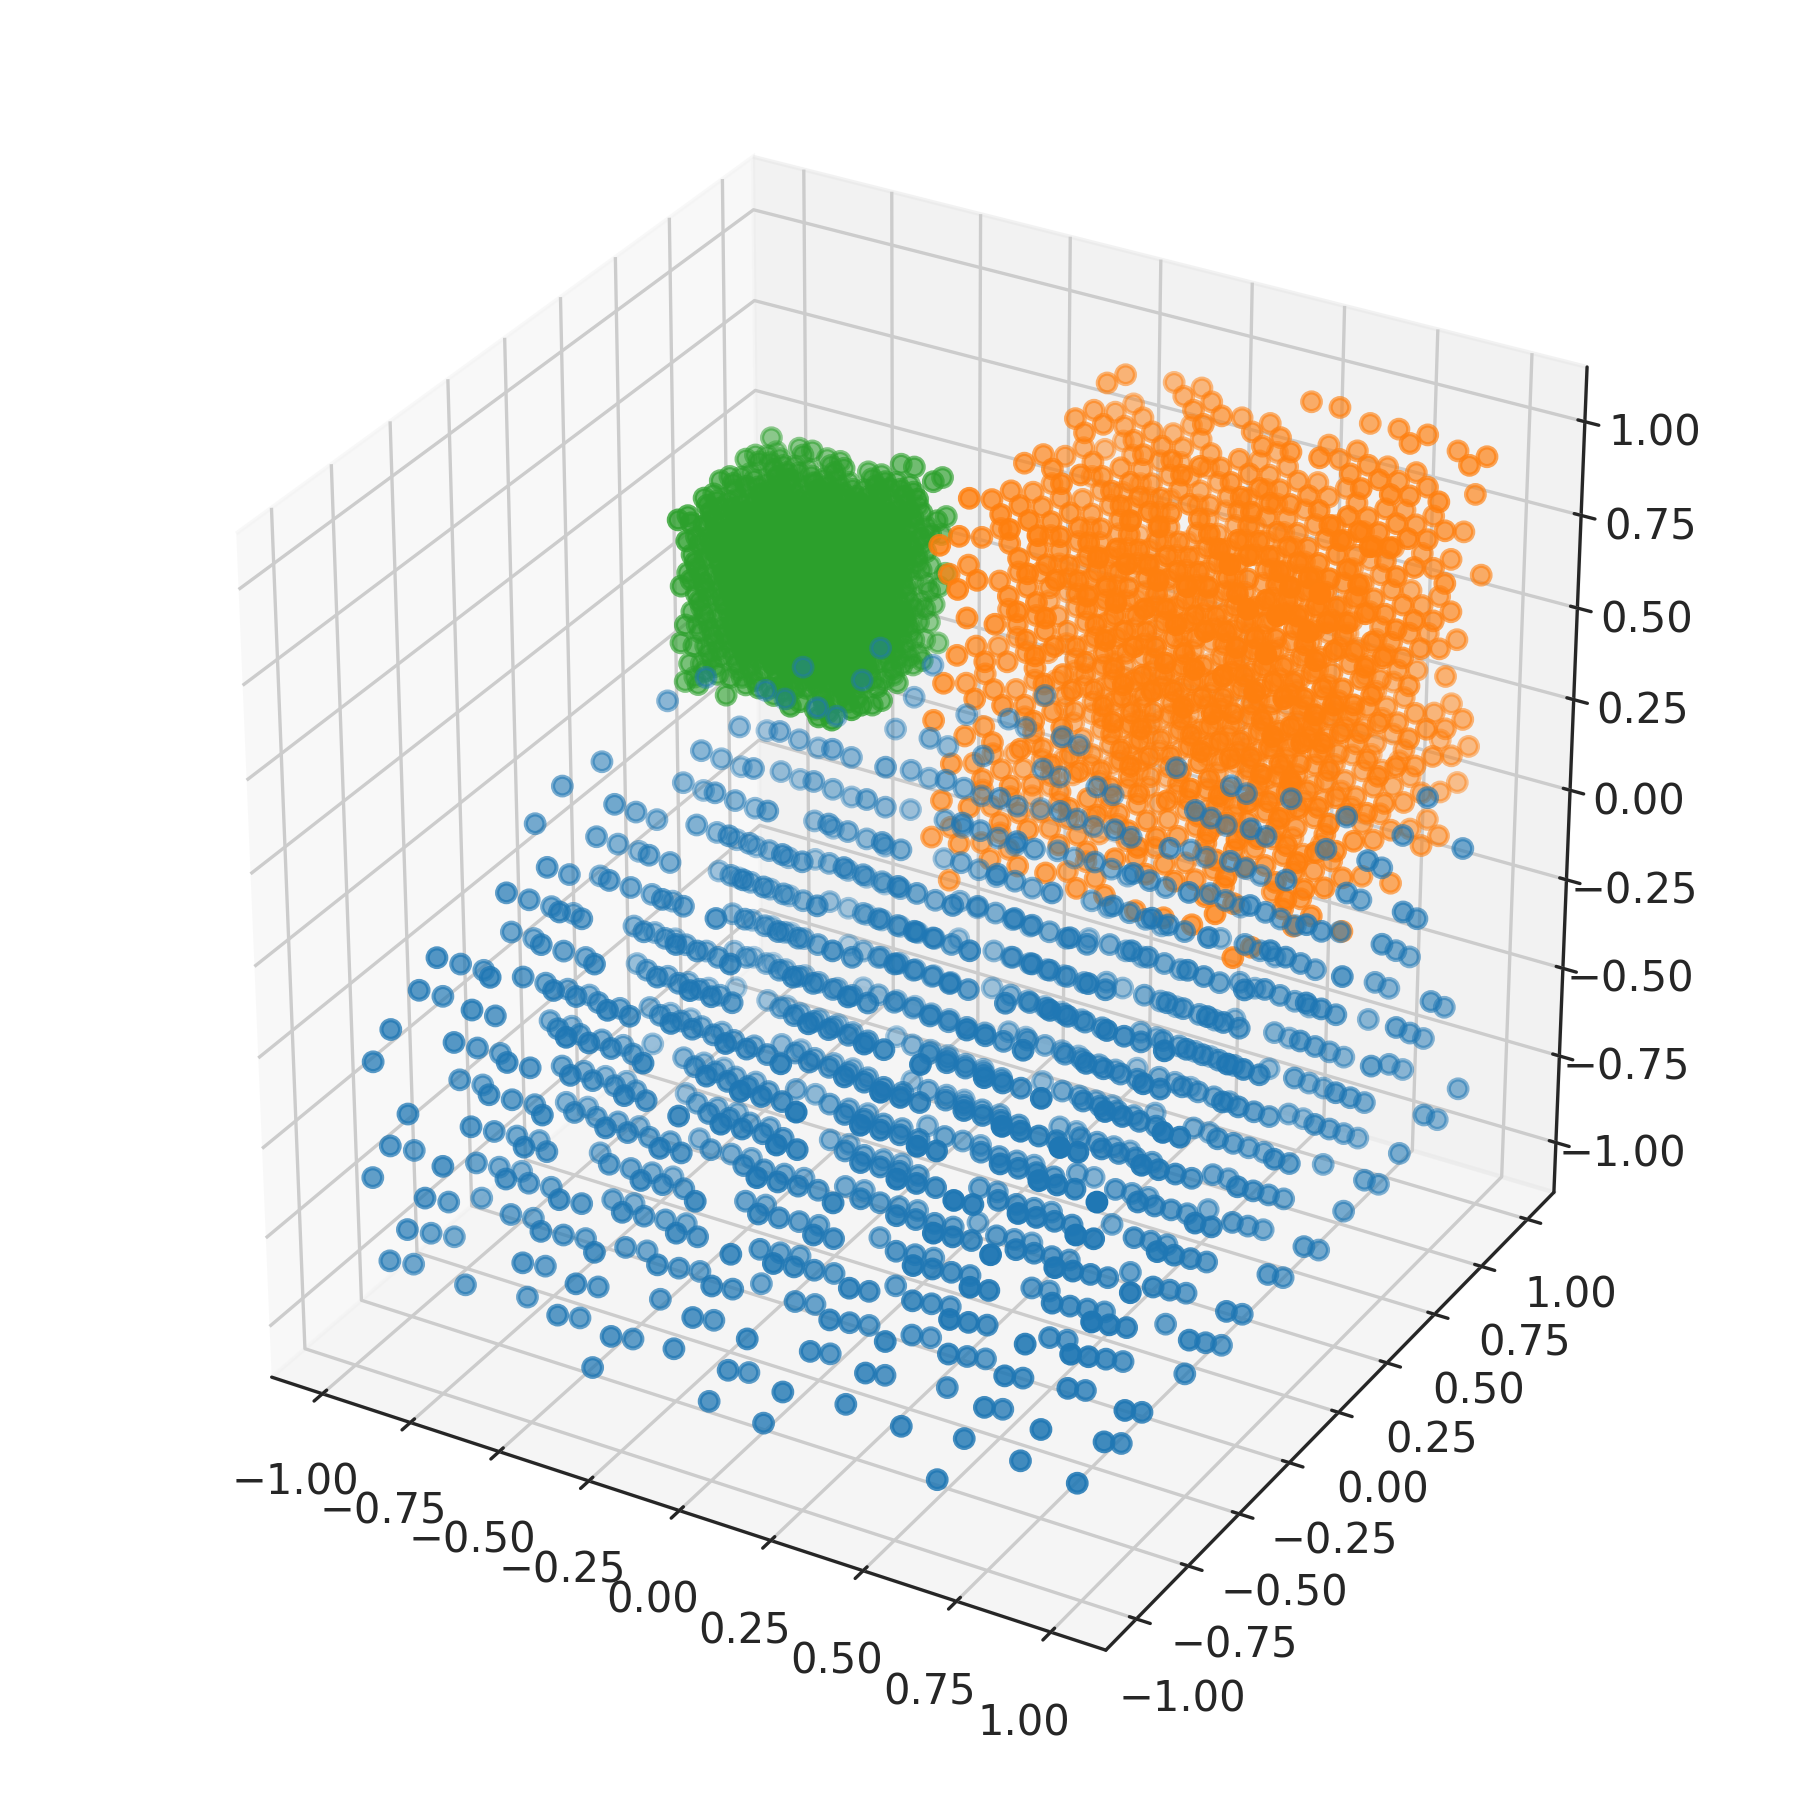
>>> from nengolib.stats import ScatteredCube
>>> s1 = ScatteredCube([-1, -1, -1], [1, 1, 0]).sample(1000, 3)
>>> s2 = ScatteredCube(0, 1).sample(1000, 3)
>>> s3 = ScatteredCube([-1, .5, 0], [-.5, 1, .5]).sample(1000, 3)
>>> import matplotlib.pyplot as plt
>>> from mpl_toolkits.mplot3d import Axes3D
>>> plt.figure(figsize=(6, 6))
>>> ax = plt.subplot(111, projection='3d')
>>> ax.scatter(*s1.T)
>>> ax.scatter(*s2.T)
>>> ax.scatter(*s3.T)
>>> plt.show()
Methods
sample(n[, d, rng])Samples npoints inddimensions.- low :

