nengolib.stats.Rd
-
class
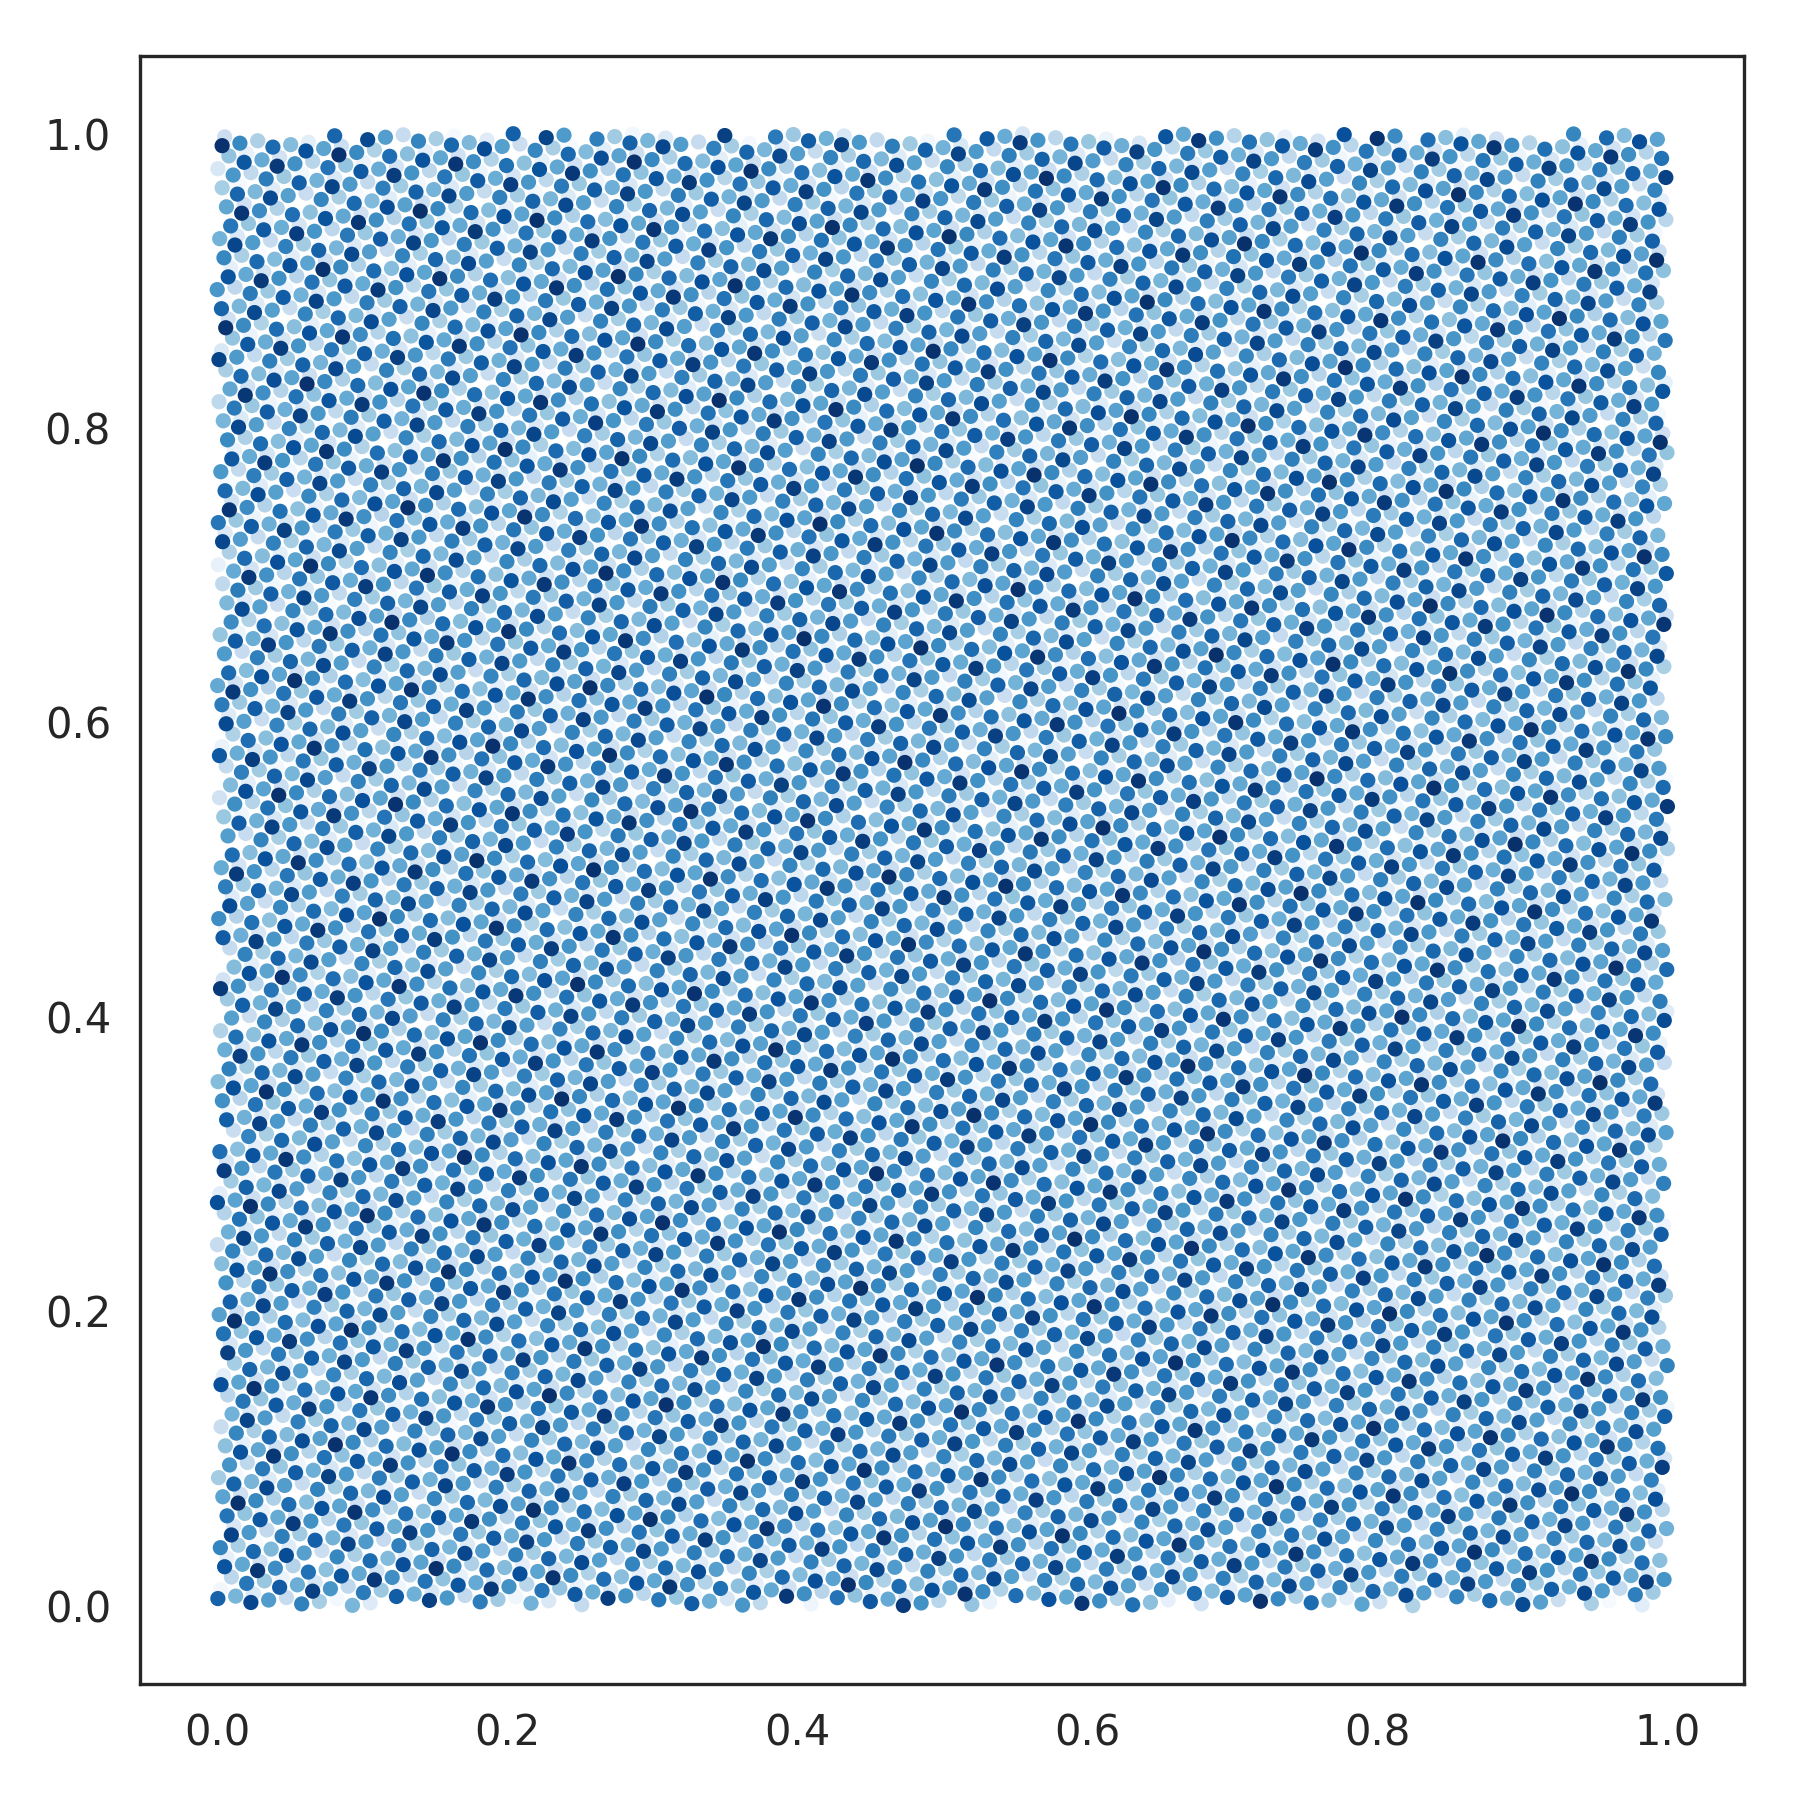
nengolib.stats.Rd[source]¶ Rd sequence for quasi Monte Carlo sampling the
[0, 1]–cube.This is similar to
np.random.uniform(0, 1, size=(num, d)), but with the additional property that eachd–dimensional point is uniformly scattered.This is based on the tutorial and code from [1]. For d=2 this is often called the Padovan sequence. [2]
See also
Sobol,ScatteredCube,spherical_transform(),ScatteredHypersphereReferences
[1] http://extremelearning.com.au/unreasonable-effectiveness-of-quasirandom-sequences/ [2] http://oeis.org/A000931 Examples
>>> from nengolib.stats import Rd
>>> rd = Rd().sample(10000, 2)
>>> import matplotlib.pyplot as plt
>>> plt.figure(figsize=(6, 6))
>>> plt.scatter(*rd.T, c=np.arange(len(rd)), cmap='Blues', s=7)
>>> plt.show()
Methods
sample(n[, d, rng])Samples npoints inddimensions.

